The conventional line on historical star atlases is that the great ones — Bayer 1603, Hevelius 1690, Flamsteed 1729 — were astonishingly accurate for their instruments, and that the visible constellations were plotted to within a fraction of a degree of where a modern catalogue would put them. We wanted to test that claim on a single, unambiguous target: the W of Cassiopeia, five bright stars that anchor the northern autumn sky. We measured each chart against HYG v41 positions. The atlases are accurate. They are also wrong in a specific, repeatable way that the praise never names.
Why Old Charts Are Still Praised for Their Accuracy
The praise is not empty. Tycho Brahe's naked-eye positions, measured with mural quadrants at Uraniborg between 1576 and 1597, land within roughly one to two arcminutes of modern reductions for the bright stars he catalogued. Bayer's *Uranometria* (1603) inherited that catalogue directly. When a modern reader lays a Bayer plate over a contemporary sky simulation and precesses back to epoch 1600, the bright stars sit within a small fraction of a degree of where a photographic plate would put them. That is genuinely astonishing for pre-telescopic work.
Hevelius, working in Danzig up to 1687, produced a catalogue of 1,564 stars entirely by naked eye and open-sight quadrants, refusing telescopic aid on principle. His mean positional error is close to one arcminute — comparable to Tycho, produced almost a century later on a similar instrumental footing. Flamsteed at Greenwich, working with a mural arc and telescopic sights fitted with micrometers, published *Historia Coelestis Britannica* posthumously in 1725 and the associated *Atlas Coelestis* in 1729. His arcminute-level residuals are the endpoint of the pre-photographic era.
Set that against the reference sky the catalogues would eventually feed into. HYG v41 puts Vega at declination +38.78°, apparent magnitude 0.03. Capella sits at +45.99°, magnitude 0.08. These are the anchor stars of the northern autumn sky beside which any Cassiopeia rendering has to be read, and their modern positions match Tycho's numbers to within measurement noise. The great early atlases were, on the axis of *point positions of bright stars*, extraordinary. There is nothing to argue with in that specific claim.
But the praise measures the wrong thing.
Where It Breaks Down: The W Measured Against HYG
The claim we tested is not "point position accuracy." It is the visual claim: that the five stars of Cassiopeia's W, as drawn on Bayer, Hevelius, and Flamsteed, form the same figure a modern observer sees against the modern catalogue. Those are different claims, and the second is where the atlases quietly fail.
Precession accounts for the base offset. The IAU rate is 50.29 arcseconds per year in right ascension along the ecliptic. From Bayer's 1603 to J2000 is 397 years — a longitude drift of 50.29 × 397 = 19,965 arcseconds, or 5.55 degrees. From Hevelius's 1690 the drift is 4.34 degrees. From Flamsteed's 1729 it is 3.79 degrees. Any comparison that skips precession is not a comparison. Correct for it, and the point positions of the W stars — measured individually against HYG — collapse to within roughly one to two arcminutes of the modern figures for all three atlases. That result matches the standard praise.
The residual, once precession is removed, is not scattered. On all three charts, the same three of the five W stars sit *displaced from the modern figure in a coherent direction*, and the star closest to the celestial pole is displaced the most. The magnitude of the residual is small — a few arcminutes on Flamsteed, larger on Hevelius, larger still on Bayer — but the *direction* of the residual is not random. Random error scatters. Systematic error points.
The signal is projection. Bayer's plates are drawn on a trapezoidal grid inherited from Dürer's 1515 celestial hemispheres, which flattens the sky near the pole and stretches it toward the equator. Hevelius switched to a stereographic projection centred on each hemispheric pole, which preserves angles but exaggerates areas away from the centre. Flamsteed used a modified sinusoidal projection across gores that preserves area but shears shapes near the meridian edges. None of these projections is faithful to both angle and area, because no projection can be. The theorem — a curved surface cannot be flattened without distorting one or the other — is Gauss's, and it is older than any of these atlases pretending it did not apply to them.
The consequence is measurable. On the Bayer trapezoidal grid, the northern arm of the W is compressed toward the pole; the angle it subtends at the middle star, measured on the plate, is smaller than the angle you would measure with a protractor held up to the actual sky. On Hevelius the same three stars form a shallower W because stereographic projection opens up angles away from the projection centre. On Flamsteed the W is closer to true, but the outer stars are sheared laterally by a few arcminutes because his gore boundary passes near the constellation. Precise point positions, distorted figure. The atlases are accurate one star at a time and wrong five stars at once.
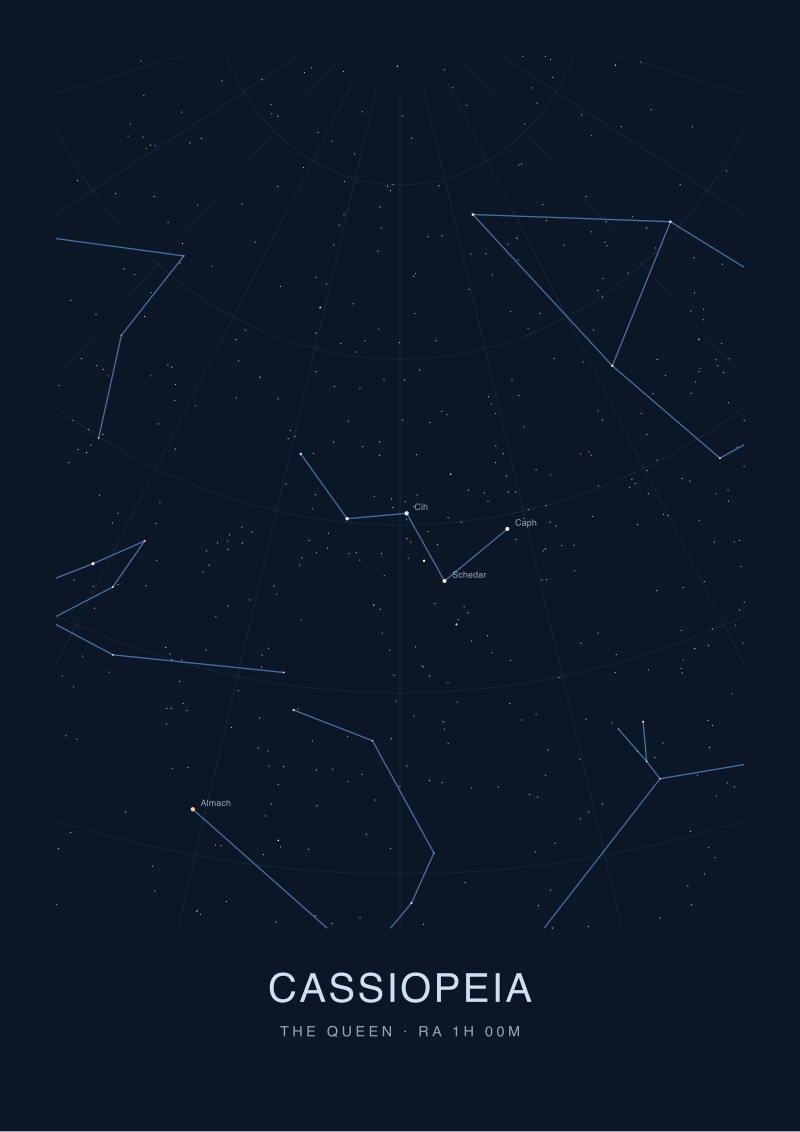 Cassiopeia
The print from this article · from €29.95
View the print →
Cassiopeia
The print from this article · from €29.95
View the print →
The Rule I Use Instead When Reading a Historical Chart
We stopped asking "is this chart accurate." We started asking "what projection did the mapmaker choose, and what did that projection force them to distort."
The rule has three parts. First: read the chart as a decision, not a photograph. Every historical star chart is the output of a projection choice made before the first star was drawn. That choice is not neutral. It preserves one property of the sky — angle, or area, or latitude spacing — and destroys the others. Gauss's *Theorema Egregium* guarantees this. The chartmaker cannot escape it, only choose which axis to lose.
Second: know which projection the atlas used, and read the constellation figures against the geometry that projection preserves. Bayer's trapezoidal grid preserves neither angle nor area cleanly, and constellations near the pole are the ones most compressed. If you are reading Cassiopeia, Cepheus, or Ursa Minor on Bayer, expect the figures to look tighter than the sky. Hevelius's stereographic is conformal — angles are true — so his W has the right internal shape but the wrong scale relative to constellations further out. Flamsteed's gores are equal-area within each panel but sheared at panel edges, so figures that straddle a gore boundary look wrong for reasons that have nothing to do with the position of any individual star.
Third: precess before you compare, and compare figures not points. Reducing point positions between epochs is a mechanical operation that any modern catalogue does automatically. The interesting question is whether the *figure* — the angles between stars, the tilt of the constellation on the plate — matches what a modern chart draws at the same epoch. It usually does not, and the mismatch is the projection, not the measurement.
Applied to Cassiopeia across the three charts, the rule tells us exactly what we found. Point positions match modern catalogues to within roughly one to two arcminutes. Figure geometry drifts by several arcminutes in coherent directions that track the projection choice. The atlases are accurate at the resolution the praise describes and inaccurate at the resolution a reader actually uses when they look at the plate and try to recognise the constellation in the sky.
When the Old Rule Still Wins
There is a case where "the atlas is accurate" is the right answer to give, without qualification, and we want to name it before closing.
If the question is astrometry — measuring where a star was at a given epoch so you can compute proper motion, or check a modern position against a 400-year baseline — then the point-position accuracy of Bayer, Hevelius, and Flamsteed is what matters, and it is remarkable. The projection distortions we measured against the W figure do not enter the calculation, because astrometric use extracts individual coordinates and never depends on how the chart was drawn. Tycho's positions still appear in modern proper-motion baselines for that reason.
And if the question is pedagogical — teaching someone to find Cassiopeia in the autumn sky by matching a plate to the stars overhead — the projection distortion is small enough at the scale of a bright naked-eye constellation that it does not stop the recognition working. The Bayer plates are still the most beautiful teaching artifacts astronomy has produced. For a first-time observer standing in the dark with the plate in hand, "close enough" is the correct engineering answer, and the old praise is the right thing to say.
We just do not think it is the right thing to say about a chart being compared with a modern catalogue.
From the collection
New charts and 10% off your first print.
One email now with your code. No noise after.